Crosstab View
Crosstab reports summarize data in a table, much like a pivot table in Microsoft™ Excel.
The report has rows and columns, but the intersections of the rows and columns represent summary data.
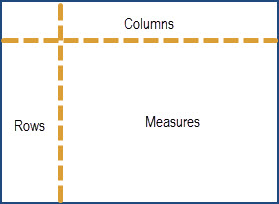
-
Columns - Data elements along the top
-
Rows - Data elements along the side
-
Measures - Data (numbers) that get summarized
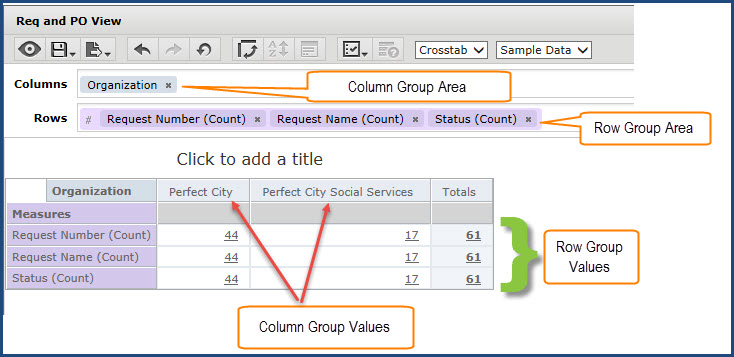
NOTE: The above is a sample image; displayed fields and columns are just a representation.
By default, a Crosstab displays a subset of the data is query retrieves. Click Full Data to view the full data-set. This may be helpful in showing a more accurate view of the final view by displaying more data. Click Sample Data to return to the smaller subset and improve performance if you find the editor has slowed down.
| COMPONENT | DESCRIPTION |
|
Columns Area |
Drag fields and measures from the Data Selection Panel to this area to create column groups. Drag fields to change the order of the groups. Measures must all be in the same area; measures cannot be in the Columns and Row areas at the same time. |
|
Rows Area |
Drag fields and measures from the Data Selection Panel to this area to create row groups. Drag fields to change the order of the groups. Measures must all be in the same area; measures cannot be in the Columns and Row areas at the same time. |
|
Row and Column group labels |
Displays the name of each field used for grouping. Right-click the group labels to use the context menu. When no row groups are defined, the words Row Group indicate this vertical region. |
|
Row and Column group values |
Heading cells that show the group values. When there is more than one level of grouping, use the icons on the outer groups to expand or collapse the inner groups. Right-click a group value to exclude it or to keep only that value from among all group values of the same level. |
|
Sorting controls |
An icon beside a label shows the current sorting. Right-click a label to apply or change sorting. You can sort on multiple groups, but only on one measure; sorting on a measure will reset all other measure columns to Don't Sort. |
|
Measure labels |
Display the name of each measure in the crosstab. Right-click the measure label to change the summary function or data format of the measure. |
|
Measures |
Measures show an aggregated value in each cell of the crosstab, as well as row and column totals for each level of grouping. Click on a measure value to open an Ad Hoc table view in a new window showing the individual values that make up the aggregated value. |
Common Tasks
The following table lists the common tasks that are performed when working with Ad-Hoc crosstabs.
| COMPONENT | DESCRIPTION |
|
Set the granularity of date groups |
When you select a date field as a group, you can specify the granularity of the group values. Right-click the group label, select Change Grouping and select Year, Quarter, Month, or Day. |
|
Pivot a single group |
To pivot any group from row to column or vice-versa, select the group by clicking its label, then drag it to the other area. You can also right-click the group label and select Move to Column Group for row groups or Move to Row Group for column groups. |
|
Pivot entire Crosstab |
To pivot all row groups to column groups and vice-versa at the same time, click |
|
Filtering |
Right-click a group label and select Create Filter to filter your data by the members in that group. Note that creating a filter from a group is very similar to slicing (Keep Only). |
|
Keep Only |
Slice out a single group by right-clicking it and selecting Keep Only. Use CTRL-click to select multiple members to keep. |
|
Exclude |
Remove a group value from any group by right-clicking it and selecting Exclude. Use CTRL-click to select multiple members to exclude. |
|
Summaries (Totals) |
By default, the crosstab includes grand totals of all row groups, shown in a Totals row at the bottom, and of all column groups, shown in a Totals column to the right. To toggle the row totals, right-click the left-most row group and select Delete Row Summary or Add Row Summary. To toggle the column totals, right-click the top-most column group and select Delete Column Summary or Add Column Summary. You cannot hide the inner totals of an expanded row or column group. |
|
Change Summary Functions |
Right-click a measure label and click Change Summary Function to select a summary function. For example, you may want to display an average rather than a total. For more information on Summaries, click here. |
|
Sorting |
Crosstabs support multiple levels of sorting:
|
|
Drill to detail |
Click a measure to drill to open an Ad Hoc table that displays a summarized column for each measure in your crosstab, the table is filtered by the group values for the measure you clicked. The original crosstab and the summarized table operate independently. |
Key Points
-
Fields may be added to crosstabs as row groups or column groups.
-
Measures may be added to crosstab rows or columns as well, but all measures must be included as either a row or a column. That is, you may add one or more measures as columns, or add one or more measures as rows, but you cannot have one measure as a column and another as a row in the same crosstab.
-
-
Measures included as rows appear in the crosstab below the Measures heading.
-
Measures included as columns appear in the crosstab to the right of the Measures heading.
-
-
When creating a crosstab, keep in mind that row and column groups are arranged in hierarchies.
Top / Bottom Filtering
You may filter numeric data shown in a Crosstab report to show only the rows with the top or bottom N values, where N is a number you specify.
For example, you may filter a Crosstab to display only the top 5 values in a column.
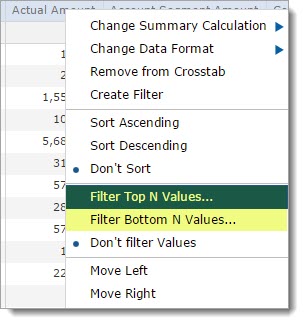
Start by right-clicking on a column heading and choose your desired filter option: Filter Top N Values or Filter Bottom N Values.
Filter Top N Values
To display the top values in a column, right-click on a column heading and select, Filter Top N Values.
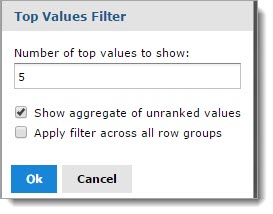
By default, the value to show field displays 5, change this value as needed. For example, to show only the top 3 values in the column, enter a 3 in this field.
Select whether to show an aggregate of the un-ranked values in the Crosstab. By default, this check box is selected.
Select whether to apply the filter across all row groups. This may be used, if more than one row groups are in the report. By default, this check box is not selected.
Click OK to apply filter.
Cancel closes the Top Values Filter window without applying or saving changes.
The report will refresh to display only those top values. A filter ![]() icon displays in the column heading
in which the filter was applied.
icon displays in the column heading
in which the filter was applied.
Right-click the column heading again and select Don't Filter Values to remove the filter.
The following image represents: Number of top values to show equals 3. Show aggregate of un-ranked values.

The following image represents: Number of top values to show equals 3. Do not show aggregate of un-ranked values.

Filter Bottom N Values
To display the bottom values in a column, right-click on a column heading and select, Filter Bottom N Values.
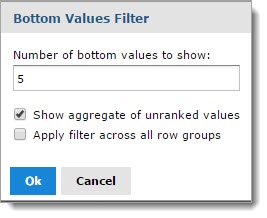
By default, the value to show field displays 5, change this value as needed. For example, to show only the bottom 3 values in the column, enter a 3 in this field.
Select whether to show an aggregate of the un-ranked values in the Crosstab. By default, this check box is selected.
Select whether to apply the filter across all row groups. This may be used, if more than one row groups are in the report. By default, this check box is not selected.
Click OK to apply filter.
Cancel closes the Bottom Values Filter window without applying or saving changes.
The report will refresh to display only those bottom values. A filter ![]() icon displays in the column
heading in which the filter was applied.
icon displays in the column
heading in which the filter was applied.
Right-click the column heading again and select Don't Filter Values to remove the filter.
Merge/Un-merge Crosstab Cells
By default, the Ad-Hoc Editor merges cells containing the same data into a larger, single cell to make the crosstab data easier to read. However, if necessary, users
may overwrite this default setting and un-merge the Crosstab cells. To display all of the individual cells in the Crosstab instead of merged cells, hover over the
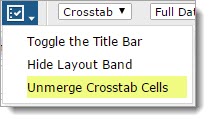
Set Ad-Hoc Properties  icon and select Un-merge crosstab cells.
The following two image show a Crosstab - first with merged cells and then un-merged cells.


To merge the Crosstab cells, hover over the Set Ad-Hoc Properties  icon and select Merge Crosstab cells.
 in the tool bar.